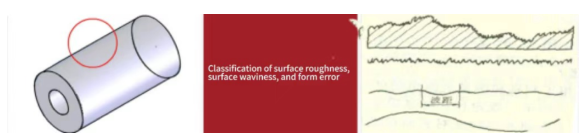
Waviness analysis constitutes a critical and common procedure in surface topography Analysis. In precision machining, through analyzing the waviness of the machining surface ensures the product surface compliance with design specifications, optimizes manufacturing processes, enhances part accuracy and property, and reduces friction/wear/noise—thereby extending product lifespan. Materials science leverages the microstructure of the material surface to analysis the mechanisms during wear/corrosion/fatigue, while semiconductor manufacturing requires the microstructure of the surface of electronic components to verify the surface quality against fabrication standards.
However, waviness and roughness often coexist in surface topography. Prior to waviness analysis, through filtering techniques separate waviness components from roughness for isolated assessment.
|
Parameter |
Spatial Wavelength |
Topographic Characteristics |
|
Surface Roughness |
<1 mm |
Microscopic geometric deviations |
|
Surface Waviness |
1-10 mm |
Macroscopic periodic undulations |
|
Form Error |
>10 mm |
Non-periodic large-scale deviations |
Per ISO 21920-1, waviness wavelengths range between 1-10 mm, while roughness wavelengths measure <1 mm. Distinguish between waviness and roughness is achieved through filter parameter configuration (Fig. 1).
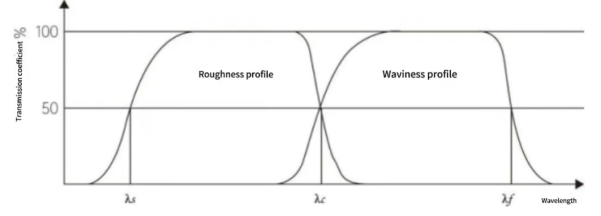
Fig. 1 Transmission characteristics of roughness and waviness profiles
Atometrics white light interferometer for surface measurement data analysis software integrates Gaussian filters and spline filters compliant. These filters can effectively separate the waviness and roughness components in the surface topography. We can distinguish between waviness and roughness by setting the filter's cut-off wavelength (λc), typically at approximately 1mm. This configuration classifies components with wavelengths below 1mm as roughness, while those with wavelengths above 1mm are categorized as waviness.
From a signal processing perspective:
2. The waviness profile is the profile formed by continuously applying two profile filters, λf and λc, to the original profile.
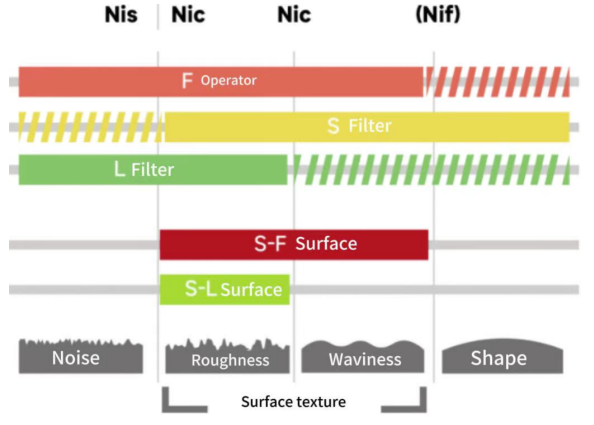
After applying the filter, through surface texture analysis, the software automatically decomposes the surface topography into waviness and roughness components, displaying them separately. This allows observation of the 3D visualization of the waviness component and calculation of waviness parameters (Such as: Wq, Wz). Similarly, the roughness component can be analyzed to compute roughness parameters (Such as: Ra, Rq).
Once waviness and roughness are distinguished via the cut-off wavelength (λc), how do we validate their separation? Two methods are recommended:
1.Parameter-based Validation
Calculate the relevant parameters of waviness and roughness (Such as: Wq/Wz for waviness, Ra/Rq for roughness). Effective separation is confirmed if:
- Waviness parameters predominantly reflect long-wavelength features.
- Roughness parameters primarily capture short-wavelength characteristics.
2. Frequency-domain Analysis via FFT
Perform Fourier Transform analysis on the surface profile. Examine the frequency spectrum to:
- Visually verify alignment of waviness/roughness with expected frequency bands.
- Quantitatively assess separation efficacy.
Additionally, compare results against standard reference datasets or calibrated samples to benchmark separation conformance.

Boardstone lntelligent(Shenzhen)Co.,Ltd.
6F Building C Kaifa Plaza,7006 Caitian Rd.,Futian Dist,Shenzhen
Hotline:400 080 3885
Sales@atometrics.com.cn
WhatsApp: +86 13316897904